 |
 | |
Consumption, Saving, Interest Rates and Capital |
||
 |
 |
|
| |
Consumption, Saving, Interest Rates and Capital |
||
|
|
This is a simple model of capital. There are two commodities which are land and corn, but start with just a model of the corn. The numbers are not intended to be realistic, merely illustrative of the general concept.
Linear models are an excellent starting point for most applied mathematics, however a purely linear model of capital has the problem that it cannot demonstrate diminishing returns and worse, there is no basis for making real decisions. A piecewise linear model is easy enough to explain, and it fits a physical story quite nicely to illustrate decision making.
It's fair to point out that the zero interest rate does not imply people will never store any corn, they may be worried about future famine or they may just not be hungry right now. Personal preference assigns a percieved value to the corn that is not intrinsic to the corn itself. If it does turn out there is a famine next year, then a lot of hungry people will percieve a pound of corn to be far more important to them than the same pound of corn was during times of plenty.
People can make a profit out of this shift in perception by exchanging corn for something else in a multi-dimensional economy... but for the time being we don't have anything else in the economy. So let's ignore the idea of trade for the moment.
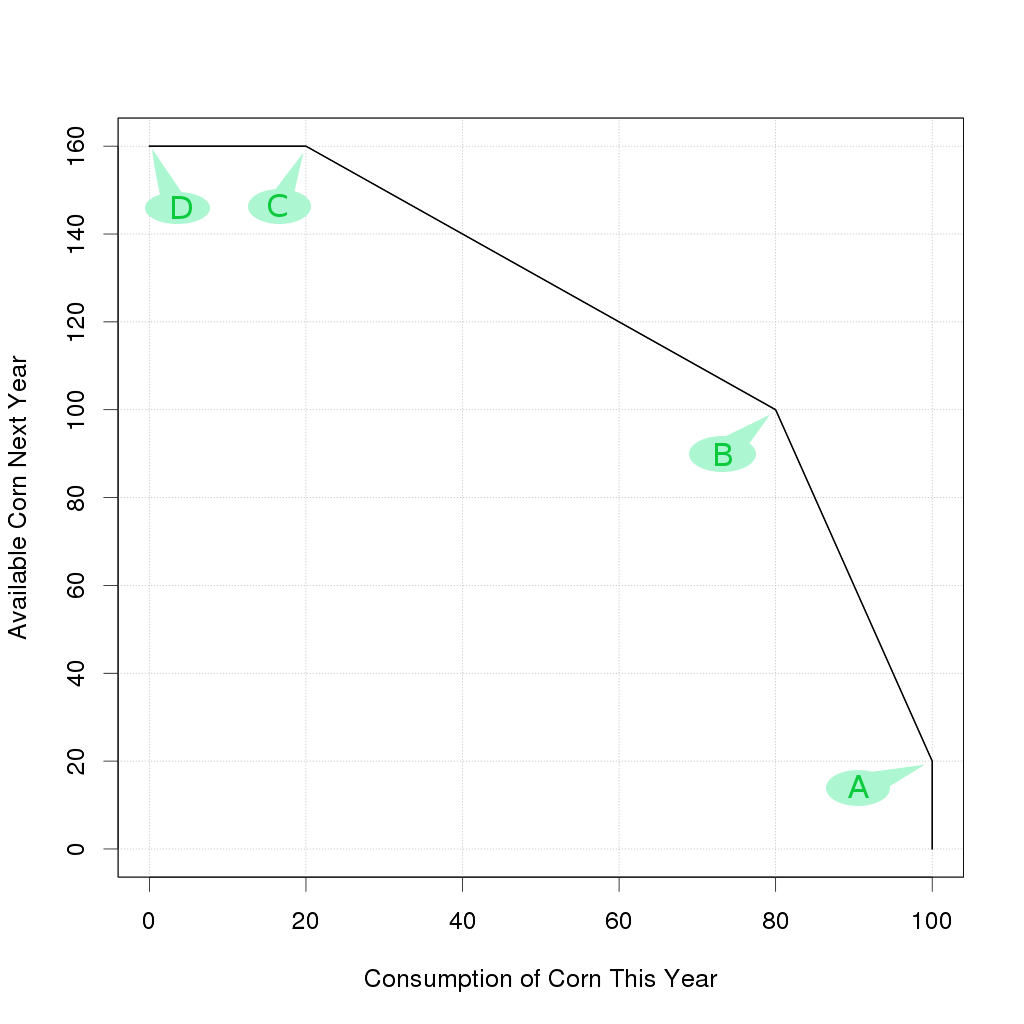
Important point to remember: the gradient at "AB" is steep, and the gradient at "BC" is less steep, thus implying a diminishing marginal return on capital as we cross point "B". This diminishing return becomes the absolutely criticial issue later on.
The going rate of interest in such a situation would be not only to pay no interest at all, but don't even bother paying back the principle.
To explore this situation, consider two people "Careful Cauliflower" and "Fearless Freddy", each of which owns an equal size parcel of land. Freddy decides to consume 90% of his produce and save 10% as "seed corn" for next year, while Cauliflower is nervous about possibly running out of corn, so she consumes only 60% of her produce and saves a big 40%. Each of these people ends up sitting at their own personal equilibrium point at the start of the planting season, so we have two red dots on the following diagram.
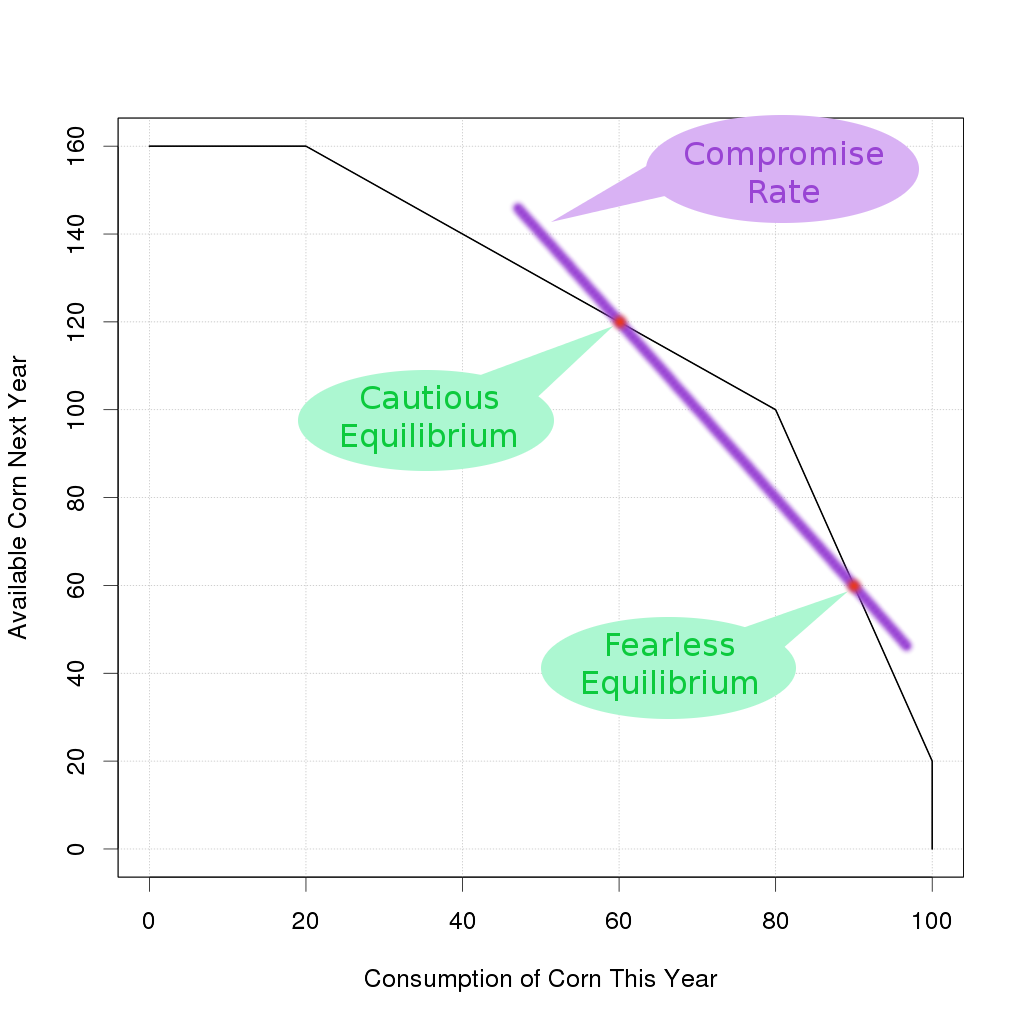
So over he goes. Cautious Cauliflower has finished her planting and has a pile of corn left over, but she doesn't want to just give it away. She offers to lend her corn to Freddy with a demand that he pay some interest. For argument sake, suppose the two of them come to a compromise over the interest rate.
Note that with the equilibrium point that Cauliflower is sitting on, her effective physical interest rate is 0%. That is to say, she could choose to store the corn and get the same corn back at 0% interest rate, but by choosing to lend to Freddy at a compromise interest rate she gets a better return. On the other hand, Freddy is sitting at a different equilibrium point on the Production Possibilities Frontier so from his perspective, every unit of corn that he borrows from Cautious Cauliflower will pay back an effective return of 300%, and that's much higher than their compromise interest rate. Both parties are happy! It's a win/win trade here.
It gets more complicated, suppose one party wants to drive a hard bargain? We know that Cautious Cauliflower will never lend at a lower interest rate than 0% because based on her personal equilibrium point, she already is guaranteed to get 0% by the physical situation. We know that Fearless Freddy will not borrow at a higher interest rate than 300% because if he did that, even after planting and pulling in a larger harvest he would be worse off. Between those two extreme limits (which are set by the physical productivity of the corn), the two of them can duke it out.
But suppose there were a whole bunch of Cautious Cauliflowers spread at various points along the "BC" interval. Suppose there were also a whole bunch of Fearless Freddies spread at various points along the "AB" interval. How could they get together and start an auction that was sufficiently fair that the parties were still willing to trade, and also satisfied the needs of as many people as possible?
In effect, what happens is that the corner at "B" is not as sharp as what this simplified piecewise linear model pretends. We really have a more rounded corner. As the various parties auction between each other, they collectively get to an equilibrium point somewhere along that rounded corner, at which point the first derivative does determine the interest rate. The preferences of the parties concerned, and their method of negotiation ends up controlling where that equilibrium point lands along the curve.
However, once we have a nonlinear model of capital, and diminishing returns do exist, suddenly that equilibrium point becomes all important! Moving the equilibrium to a different part of the curve implys different mechanisms are coming into play, and different decisions are being made. This is the place where individual preverences become significant. This is also the place where individual can trade with one another for mutual profit, and by making those trades we get a collective equilibrium determined by the marketplace.
Bringing land trades into the picture makes things more interesting... another day perhaps.
